Brochure
Demo
Jun 18, 2021
Agile Project Management Dashboard
The Challenge
The Geo Spatial Management Office (GMO) team requested a tool to measure Earned Value Management (EVM). The vehicle would provide metrics in a dynamic manner to monitor and measure areas such as productivity, profitability and performance. GMO wanted to know “what their T&M dollars were buying,” in terms of productivity.
The Solution
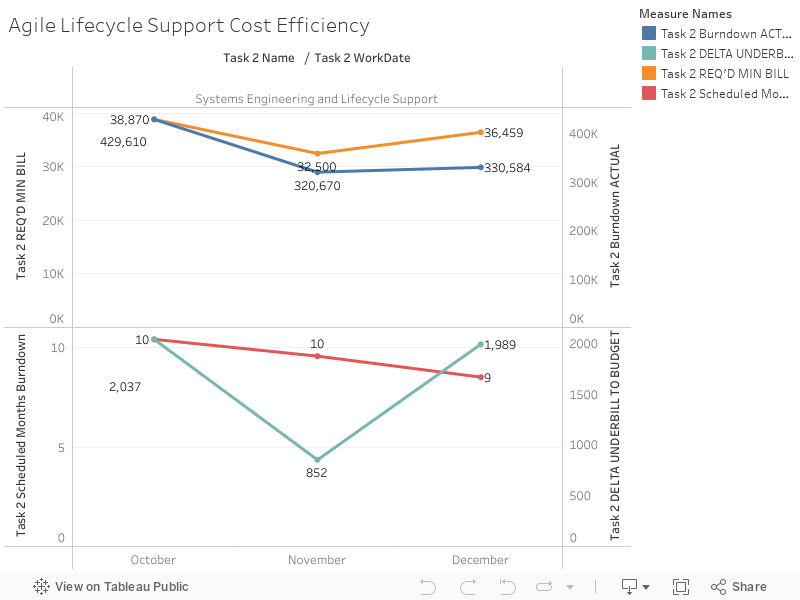
The sample dashboard embedded below substitutes synthetic data as the underlying dataset in order to protect proprietary information.
The DSA team, in conjunction with the GMO project leadership, employed Tableau software to create an interactive dashboard which would convey the desired metrics in a dynamic manner. Specifically, Tableau would use and join data from:
- Ardent’s Unanet, for time-tracking data
- GMO’s Jira, for Jira issue keys and Agile story points completed
The Outcome
Tableau desktop software allowed creation of an interactive dashboard where information relevant to the GMO team can be analyzed to aid in management decisions going forward.
Data Fields or Metrics Captured (actual v. projected):
- Burndown projection
- Monthly billings
- Tasks completed
- Tasks in the backlog
- Tasks in progress